Chapter 6 Carbon Dioxide in the Earth System
As we saw in Chapter 4, the amount of carbon dioxide in the atmosphere has been remarkably stable for most of the last 2000 years. But in Chapter 5, we found that over longer spans of time—tens to hundreds of thousands of years—natural processes have caused carbon dioxide to vary and that for more than 120 years, scientists have claimed that these variations were largely responsible for the cycles of climatic change that caused the glaciations of the Pleistocene (from about 2.7 million years ago until about 10,000 years ago).

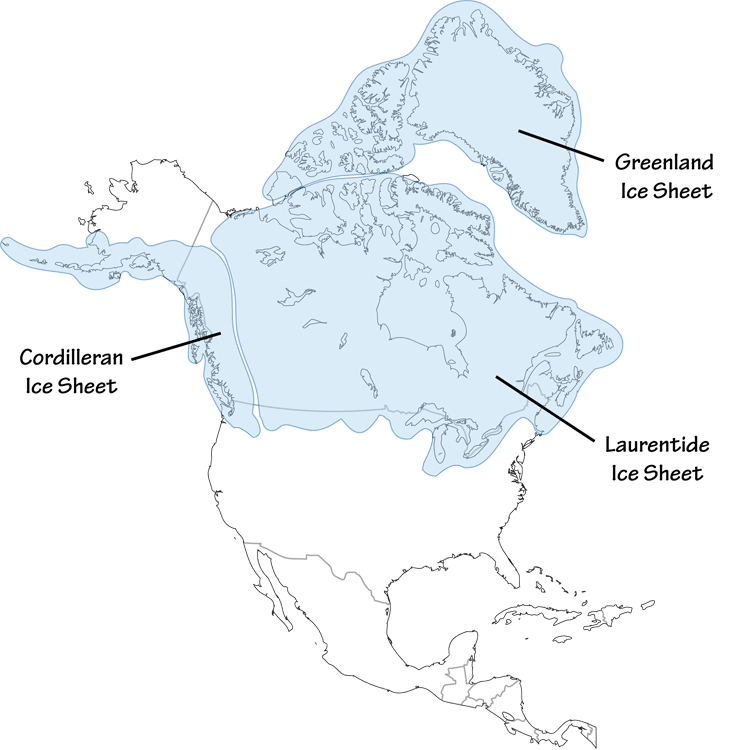
Figure 6.1: The Laurentide ice sheet, at its maximum extent, about 25,000 years ago.
These natural climatic cycles were sufficient to cause dramatic climatic changes, with glaciers advancing to cover much of Northern Europe as well as most of Canada and much of New England, New York, and the region near the Great Lakes with as much as a mile or two of ice (Figure 6.1. These glaciers created much of the landscape of those areas, including the Great Lakes and Cape Cod. But these changes were minuscule compared to the climatic changes on our neighboring terrestrial planets. Mars and Venus once had mild climates had liquid water on their surfaces and may have had vast oceans. But their climates diverged. Mars became so cold that every winter, trillions of tons of carbon dioxide freeze and fall to the ground in its polar regions in layers 1–8 meters (3–25 feet) thick and extending for hundreds of miles across the land, Venus heated up until its oceans boiled dry and its surface is now about 800°F, hot enough to melt lead.
Scientists are confident that it is almost impossible, no matter how extreme human-caused global warming becomes, for the Earth to follow Venus’s fate, but understanding natural changes in carbon dioxide and the accompanying climatic changes on Earth and other planets can help us understand how the climate system works and what might happen to Earth’s climate as carbon dioxide levels rise.
6.1 Carbon in the Earth System

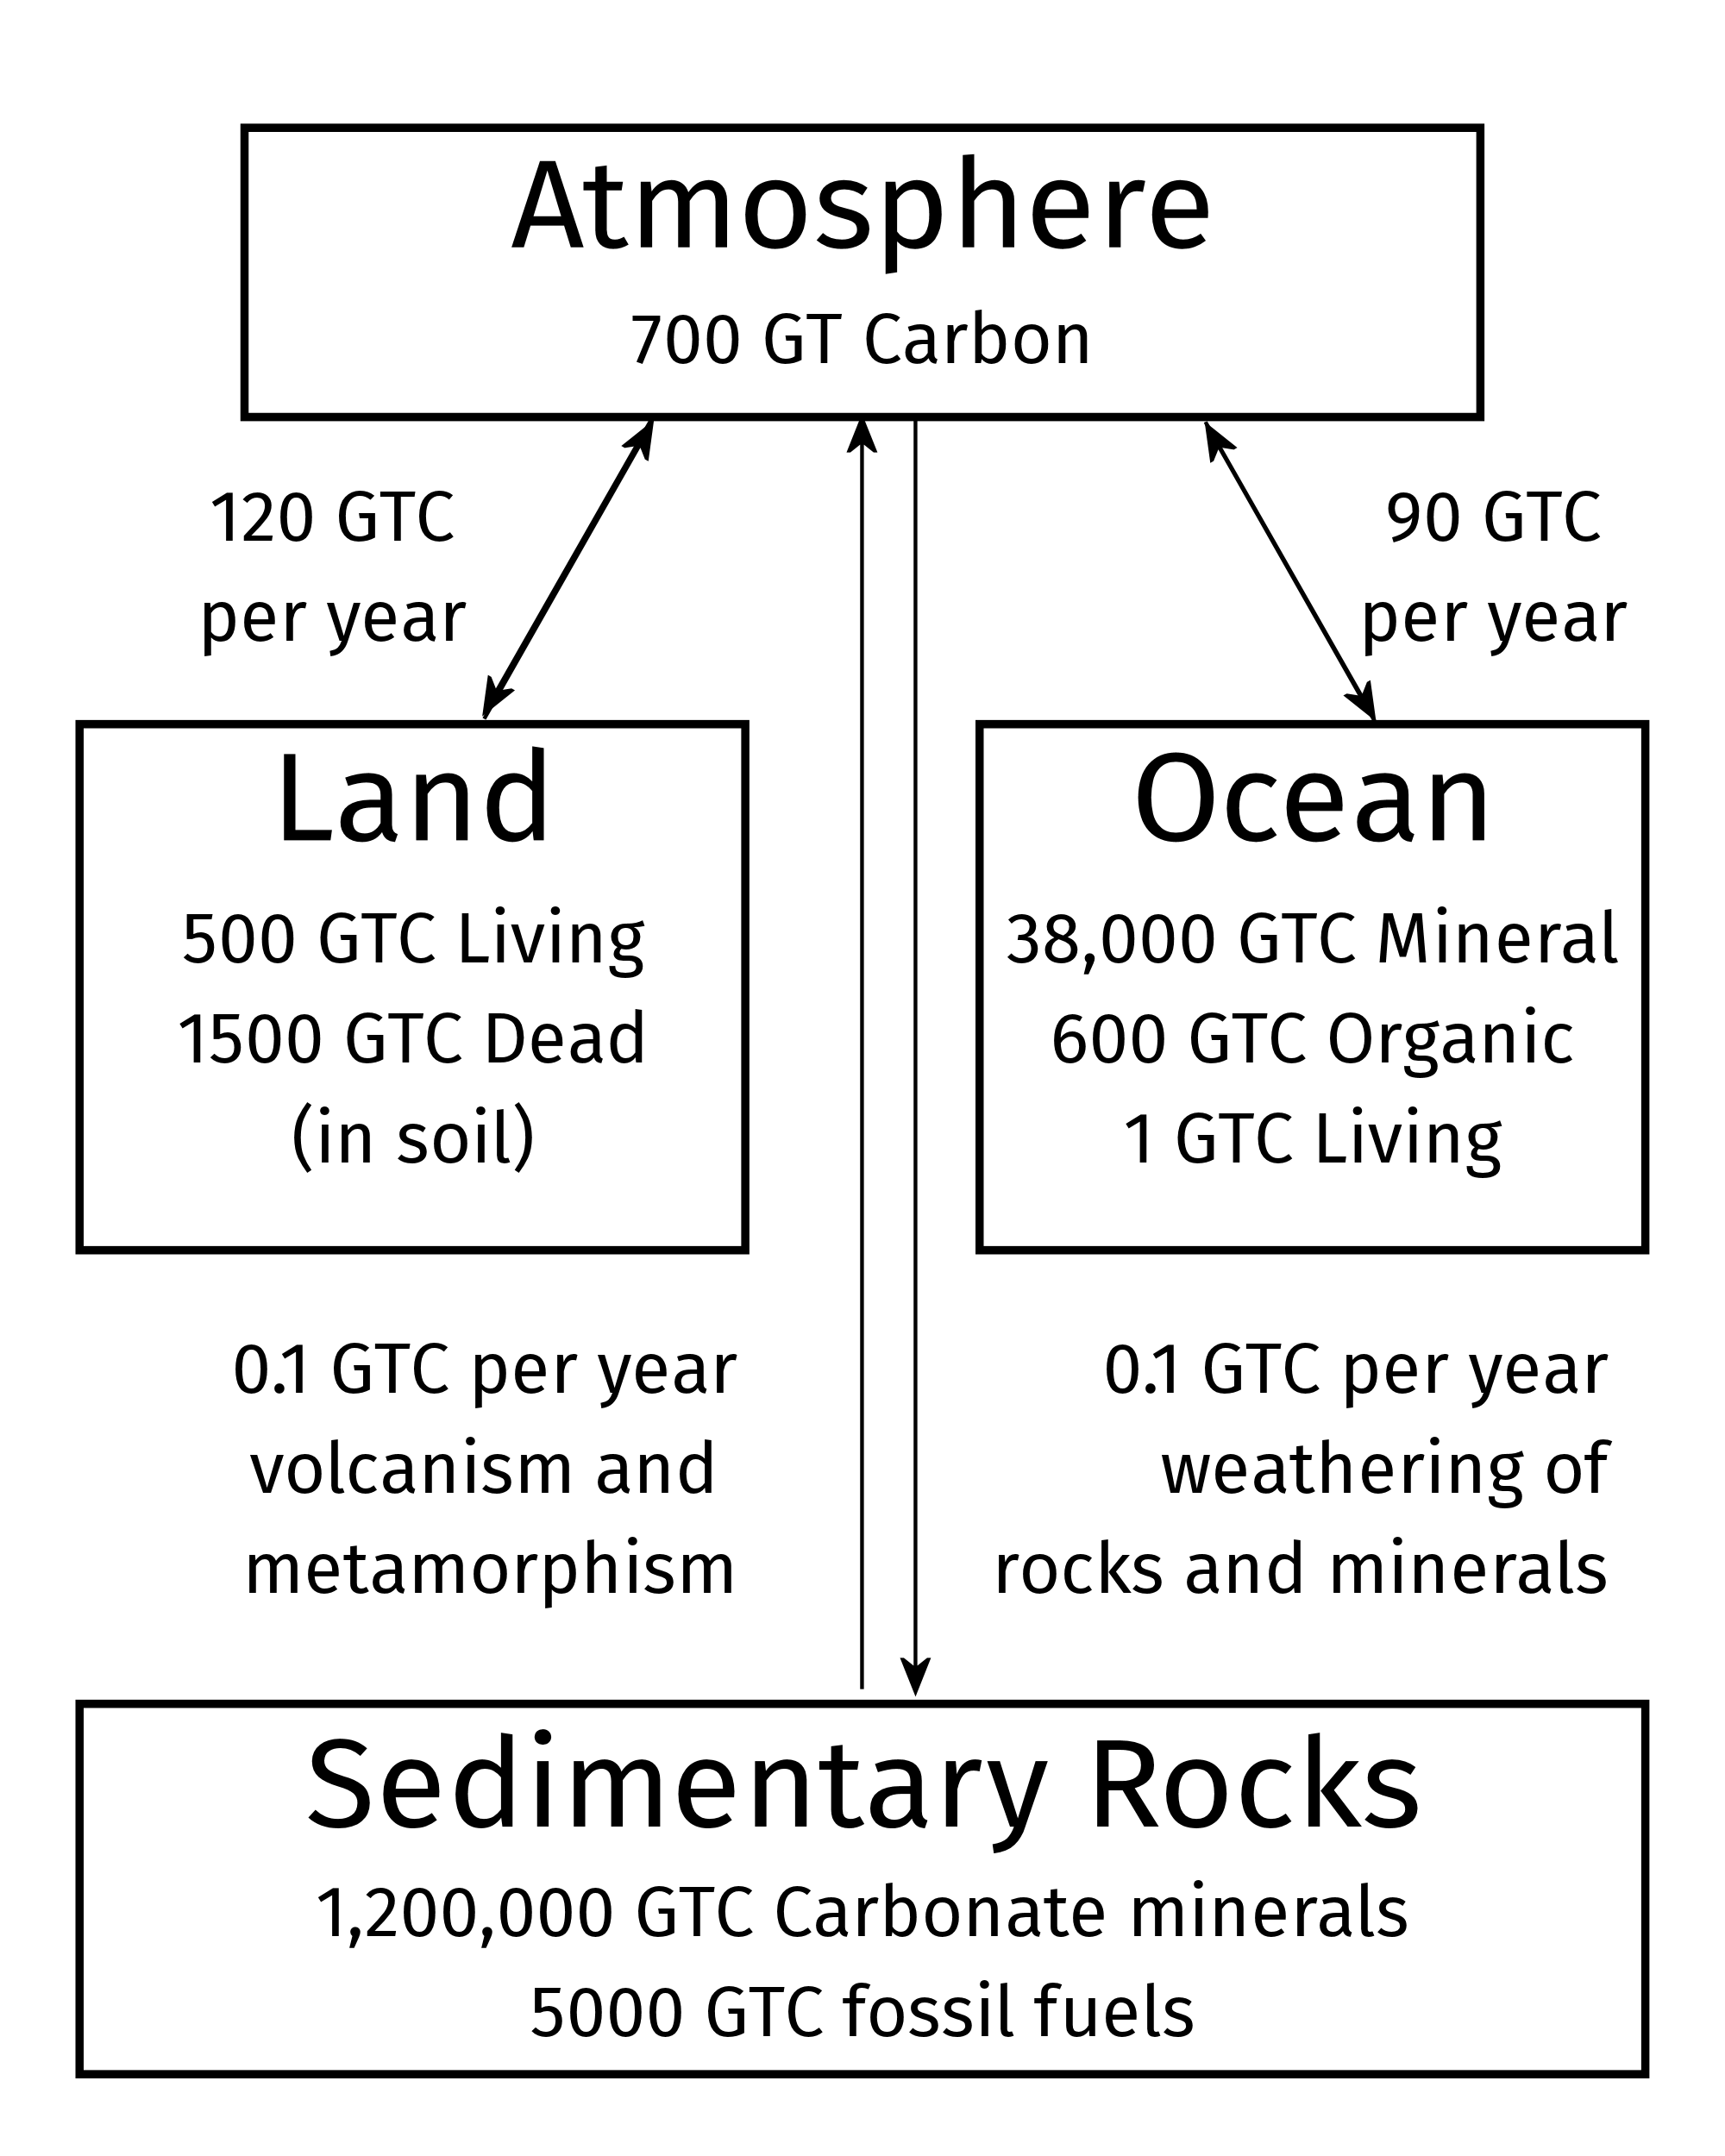
Figure 6.2: Reservoirs of carbon in the earth system. Quantities are in gigatonnes (billions of metric tons) of carbon atoms in different chemical forms. The arrows show the fluxes of carbon moving through the earth system each year.
Before the industrial revolution, all of the carbon in the atmopshere (mostly CO2, but small amounts of other molecules, such as methane) comes to about 700 billion metric tons (gigatonnes, or GT) (Figure 6.2). This is a lot, but it is dwarfed by the amount of carbon in other parts of the earth system, especially mineral forms dissolved in the oceans and solid carbonate minerals in the ground, such as limestone, dolomite, chalk, and marble.
The distribution of carbon across the different parts of the earth system is important because carbon is constantly moving between these parts. The most dramatic transfers are what the scientist David Archer calls the earth’s “breathing”: Each year, photosynthesis by plants removes about 120 billion tons of carbon from the atmosphere, and respiration by plants and animals, and the decay of dead plant matter return roughly the same amount to the atmosphere. Similarly, every year about 90 billion tons of carbon dissolve into the ocean and roughly the same amount is released back to the atmosphere by outgassing from the oceans.
There are also much smaller, but much smaller fluxes of about 100 million tons per year of carbon that is emitted into the atmopshere by volcanoes and related geological processes and a similar amount is returned to the solid earth when chemical reactions involved with the weathering of rocks and minerals slowly converts atmospheric carbon dioxide into solid carbonate minerals, such as limestone.
6.1.1 The Earth System Breathes
Before the industrial revolution, these fluxes into and out of the biosphere and the oceans were very closely balanced and that balance is why the amount of carbon in the atmosphere was so stable for most of the last 2000 years. Every year, about one third of all the carbon in the atmosphere was removed and then restored by the “breathing” of the oceans and the biosphere. When scientists refer to this carbon cycle, processes that add carbon to the atmosphere are called sources and processes that remove carbon are called sinks.
However, as people started to burn billions of tons of fossil fuels every year, these balances were disrupted because there is no balancing sink to remove it. THe earth system has mechanisms that promote stability in the carbon cycle and the biological and ocean sinks have sped up, so that about half of the carbon released to the atmosphere from fossil fuels is removed by these ehnanced sinks, but the other half remains in the atmosphere and builds up over time.
6.2 Measuring Changes in CO2 and Temperature
In 1957, a young chemist called Charles David (Dave) Keeling built a sensitive instrument to measure CO2 in the atmosphere and installed it in an observatory on Mauna Loa, Hawaii. That observatory has measured CO2 continuously since 1958 and in the subsequent years, many other CO2 monitoring stations were established all around the world, from the tropics to the artcic and antarctic. There is even a monitoring station at the South Pole.
6.2.1 Changes in CO2

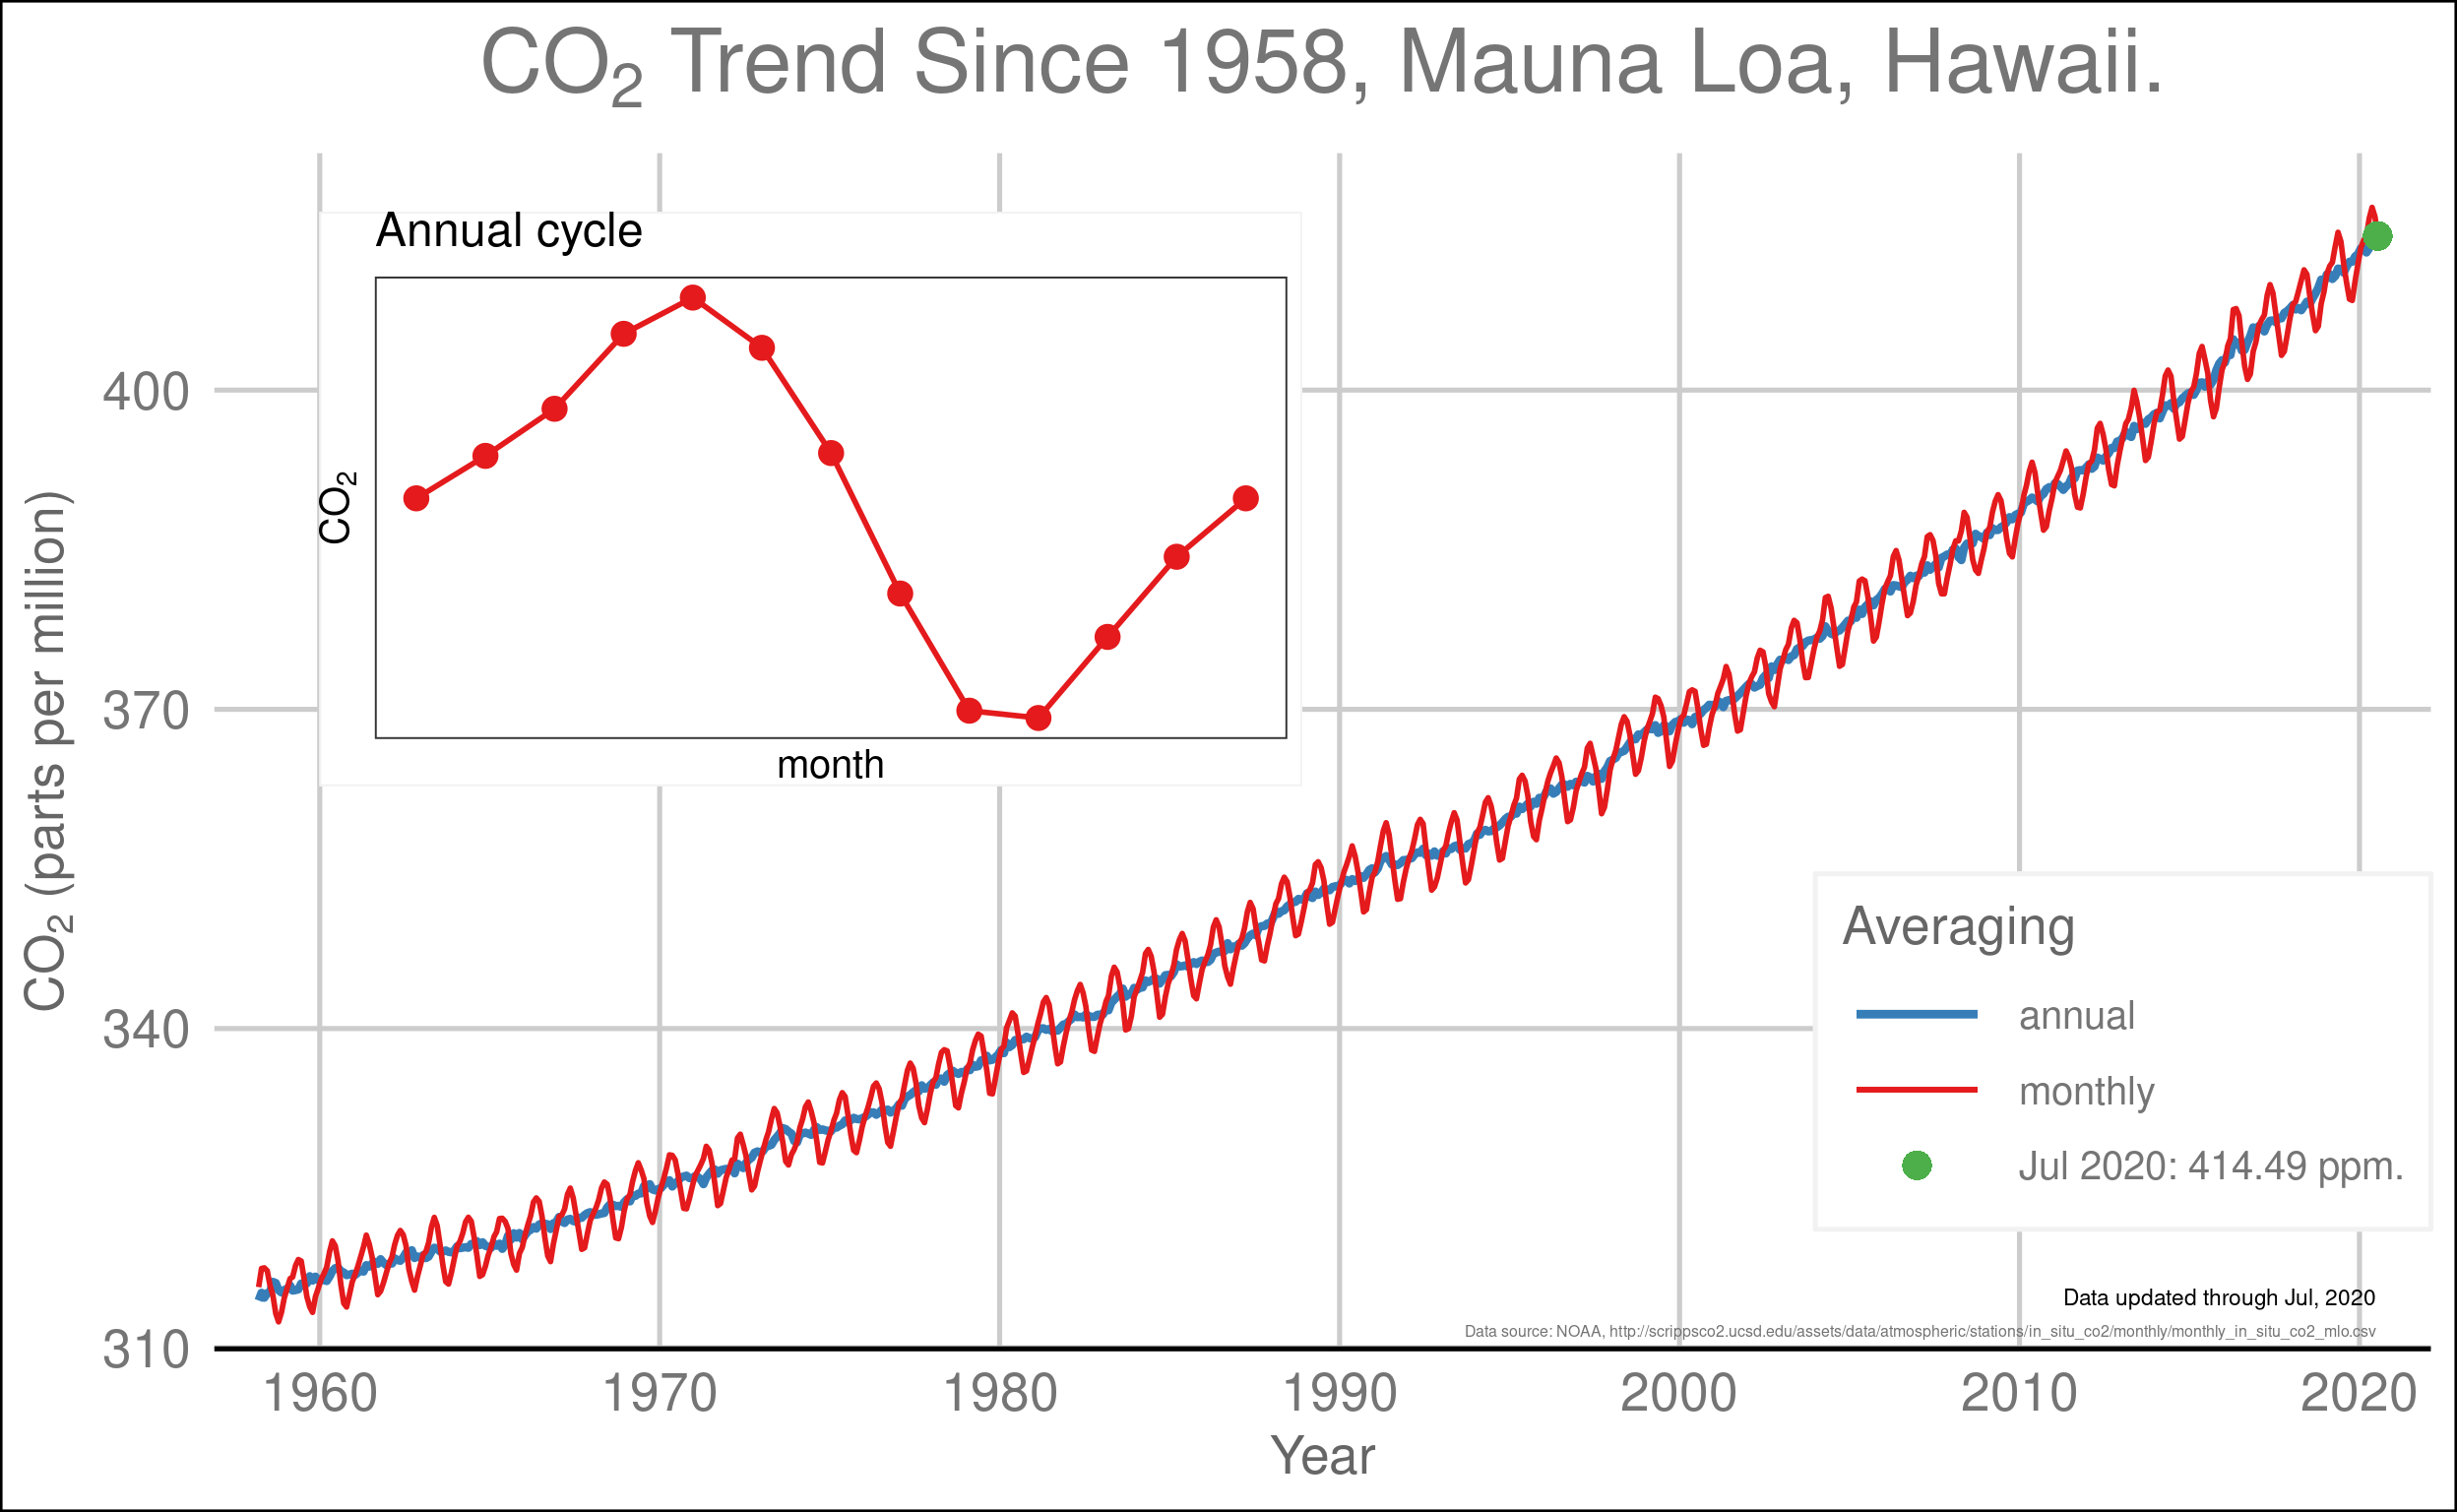
Figure 6.3: The atmospheric concentration of CO2 as measured at Mauna Loa, Hawaii, since 1958. The red curve shows the monthly measurements and the blue line shows the annual average, which smooths out the seasonal variations. The inset shows the average annual cycle driven by photosynthesis, respiration, and decay.
When Keeling began his measurements in 1958, the amount of CO2 in the atmosphere was about 315 parts per million (ppm). THe level has risen steadily for more than sixty years and is now over 410 ppm (an increase of more than 30%).
We can also see in FIg. 6.3 the “breathing” that David Archer describes. From roughly May–October as plants flourish in the Northern Hemisphere, their photosynthesis removes CO2 from the atmosphere and from November–April, the plants are dormant and respiration and decay return a roughly equivalent amount of CO2 to the atmosphere.
Without fossil fuel consumption, these two processes would balance each other and there would be little change in CO2 from year to year. However, the emissions from fossil fuel consumption are not balanced, so every year the amount of CO2 in the atmosphere increases by slightly less than 2 ppm.
6.2.2 Changing Temperature
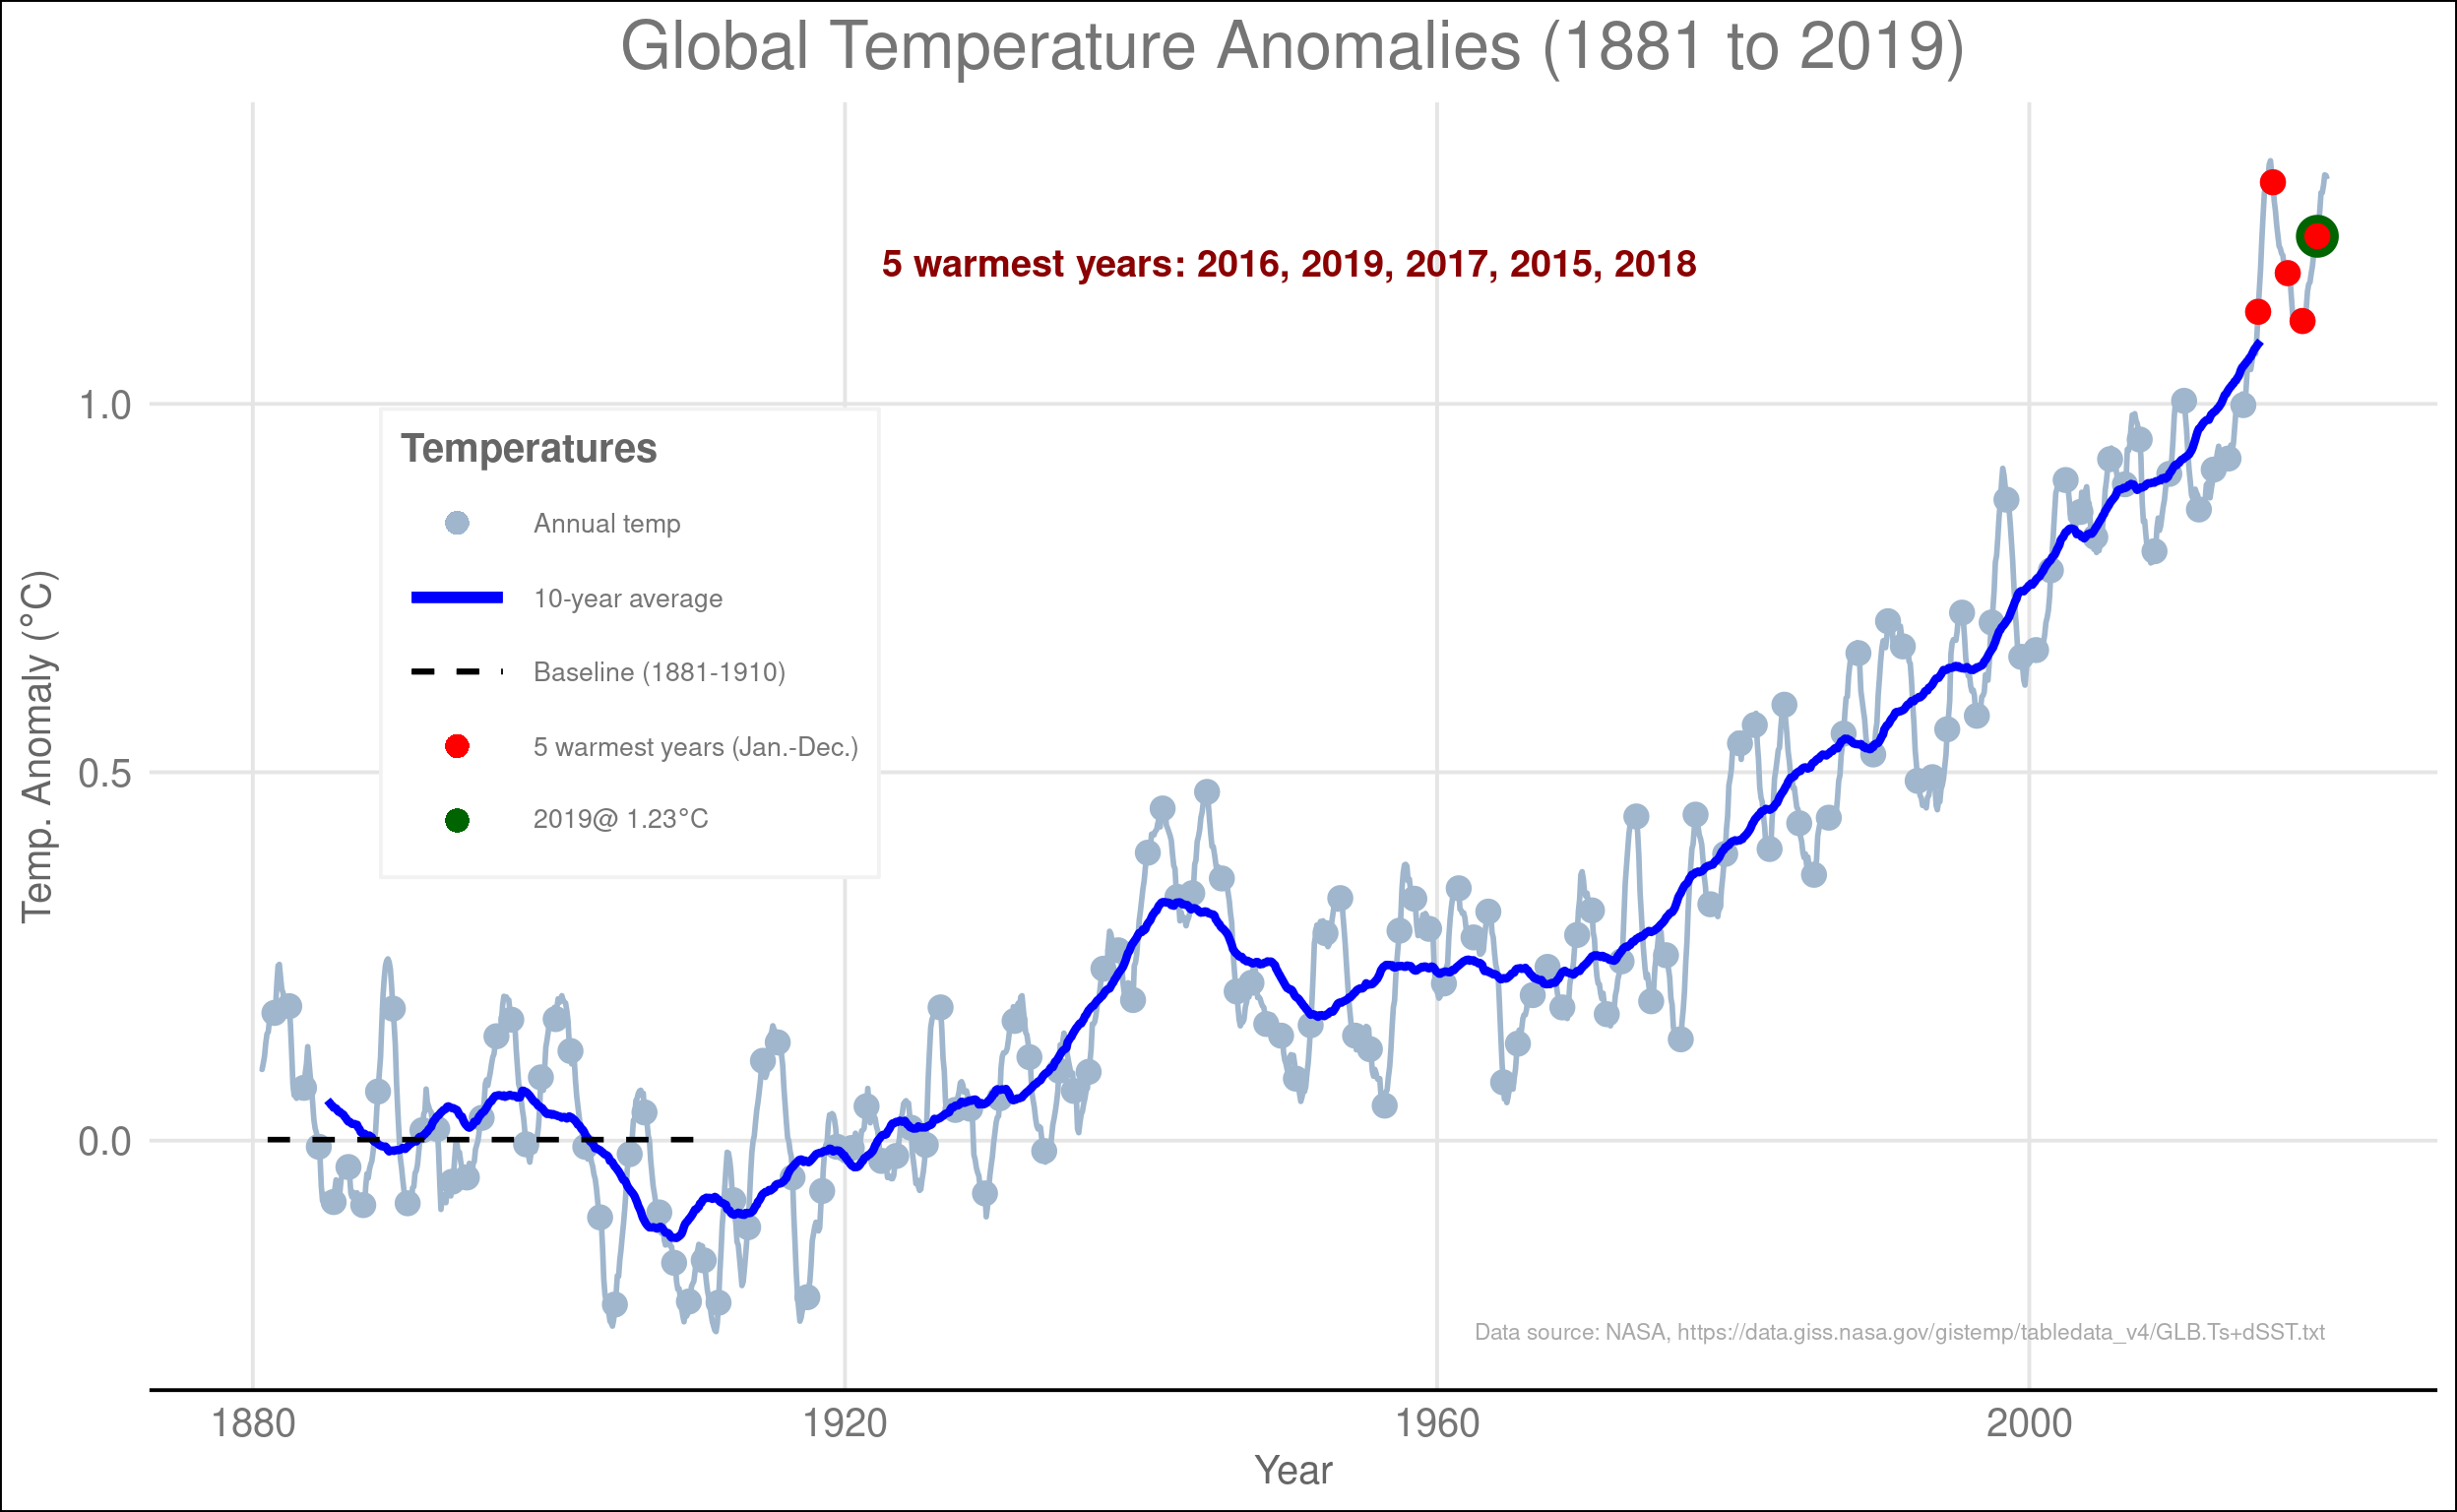
As CO2 has risen, so have temperatures. Figure 6.4 shows the change in global average temperature since 1881. Before the late 1960s, there was a general warming trend, but it was mild and there were long periods where the temperature was steady or even falling. However, since the late 1960s, the temperature has risen steadily and is now considerably hotter than in the previous 140 years. The last five years were the five hottest years on record. Nineteen of the 20 hottest years on record happened in the last 20 years (the exception was 1998, which was the 15th hottest year on record). years on record

Figure 6.4: Changes in global average temperature since 1881. Temperature is measured as anomalies, which measures the difference of each month from the average temperature for that month during a reference period of 1881–1910. Anomalies make it easier to compare changes in summer months to winter months and to compare changes in tropical places to changes in temperate or polar regions. The gray dots and lines show annual temperatures and the blue line shows the decadal average, which smooths out the year-to-year fluctuations and shows the trend more clearly. The five warmest years on records are shown in red and the most recent year is shown in green.